Table of contents
Key takeaways
- LLM observability is how teams trace, evaluate, and track usage in LLM applications to explain why a model gave a given answer.
- The five core components are tracing, evaluation, prompt management, cost and token tracking, and guardrails and security monitoring.
- A good setup starts with clear targets, instruments every model call, and turns failing production traces into test cases.
LLM observability explained
LLM observability gives teams continuous visibility into the inputs, outputs, internal steps, performance, and output quality of applications built on large language models. In practice, LLM observability tracks what your LLM application did, how long it took, what it cost, and whether the answer was any good.
LLM applications need their own approach because they're non-deterministic. The same prompt can return different answers. Multi-step chains and agent reasoning are hard to inspect from the outside, so a plain log line rarely explains a bad result. A fluent answer can still be wrong.
Consider a support chatbot that returns an outdated refund policy. With LLM observability, the team opens the trace and sees that the retrieval step pulled the wrong document. The team doesn't blame the model, and the fix targets the right step.
AI engineers, data scientists, platform teams, and product owners responsible for AI features in production all use LLM observability. Each group reads the same traces for different answers. Engineers look for failing steps, data scientists look for quality trends, and product owners look for the link between model behavior and business outcomes.
Why LLM observability matters
LLM observability matters because LLM applications fail through wrong answers, drifting quality, and rising costs that ordinary error codes never reveal. The main reasons are:
- Hallucinations and wrong answers. Failures show up as confident but incorrect LLM responses instead of error codes. Traces and evaluation scores let you catch them before users do.
- Unpredictable outputs. Model updates, prompt edits, or new user behavior can change LLM responses and model behavior without any code change. Tracking quality signals over time exposes the shift early.
- Complex multi-step workflows. RAG pipelines and LLM agents chain retrieval, tool calls, and several LLM calls, so one weak step affects the final answer.
- Latency and cost from third-party APIs. Token usage and provider response times directly affect user experience and budget.
- Privacy and compliance. Prompts and responses can contain personal or sensitive data that needs controlled handling.
How LLM observability differs from related practices
LLM observability differs from monitoring in the questions it answers, from traditional APM in what it measures, and from ML observability in how it judges output. The three comparisons below show where each practice stops and LLM observability begins.
LLM observability vs LLM monitoring
LLM monitoring tells you what is wrong, while LLM observability tells you why. LLM Monitoring tracks predefined metrics and alerts when something crosses a threshold. Observability lets you explore traces and context to find the cause. Root cause analysis is where the two diverge most.
Monitoring is a part of observability, not a replacement for it. Teams need both, because alerts only help when someone can investigate them. The table below compares LLM monitoring and LLM observability across five aspects.
Aspect | LLM monitoring | LLM observability |
|---|---|---|
Main question | Is something wrong? | Why is it wrong? |
Data used | Predefined metrics | Traces, logs, evals, metadata |
Typical output | Dashboards and alerts | Root-cause analysis |
Handles unknown issues | Limited | Yes |
Example | Latency alert fires | Trace shows slow retrieval step |
LLM observability vs traditional APM
Traditional application performance monitoring (APM) measures system health, while LLM observability measures behavior and output quality. APM tracks CPU, memory, HTTP error codes, and uptime. LLM observability adds semantic quality by asking whether the answer was correct, relevant, grounded, and safe.
An LLM request can return HTTP 200 and still be a failure because the answer is wrong. APM sees a healthy service, while only LLM observability sees the bad output. The table below compares traditional APM and LLM observability across five aspects.
Aspect | Traditional APM | LLM observability |
|---|---|---|
Focus | System performance | Behavior and output quality |
Key signals | CPU, memory, error codes | Tokens, latency, eval scores |
Failure type | Crashes, timeouts | Wrong or ungrounded answers |
Determinism | Same input, same output | Same input, varied output |
Cost tracking | Infrastructure | Per token, model, and user |
APM confirms the service is up. LLM observability confirms the answer is right.
LLM observability vs ML observability
ML observability and LLM observability differ mainly in the type of output they judge. Classic ML observability watches structured predictions with metrics such as accuracy, precision, and data drift. LLM responses are free text, so those performance metrics don't fit. Teams rely on LLM-specific evaluation metrics instead, including LLM-as-a-judge, groundedness checks, and human feedback. The table below compares ML observability and LLM observability across three aspects.
Aspect | ML observability | LLM observability |
|---|---|---|
Output type | Structured predictions | Free text |
Core metrics | Accuracy, precision, drift | Relevance, groundedness, tone |
Evaluation | Labeled test sets | LLM-as-a-judge, human review |
5 core components of LLM observability
The main components of LLM observability are tracing, evaluation, prompt management, cost and token tracking, and guardrails and security monitoring. Together they cover what happened, how good it was, which prompt caused it, what it cost, and whether it was safe. Each component answers a different question about your LLM applications, and the sections below take them in order.
1. Tracing
Tracing records the full journey of one request as a trace, made of nested spans. Those LLM spans cover the user input, retrieval from a vector database, tool calls, each LLM call, and the final response. Together they map the agent decision paths from start to finish, and relevant metadata such as the LLM client and model configuration rides along with each span.
Each span carries latency, token usage, inputs, and model outputs. Teams can track latency across LLM calls and see exactly which step failed or slowed down. Tracing matters most for RAG in AI pipelines and AI agents, where one user request can trigger many steps. Tracing also exposes performance bottlenecks that a single end-to-end timer hides.
PRO TIP: Pass one shared trace ID through every service a request touches. It lets you connect the model call to the retrieval step, the tool calls, and the user session in one view.
2. Evaluation
Evaluation measures output quality with metrics such as accuracy and relevance, and it turns "this answer feels off" into evaluation scores you can compare across models, prompts, and releases. The common evaluation methods are:
- Automated evaluators. These include LLM-as-a-judge, which scores model outputs at scale.
- User feedback. Signals from user interactions, such as thumbs up or down and sentiment analysis of follow-up messages, show how real people rate answers.
- Manual scoring. Human reviewers (human-in-the-loop) handle subtle cases that automated checks miss.
Typical quality dimensions are factual accuracy, relevance, groundedness in source data, and tone. Teams that run LLM evaluation regularly also rely on LLM grounding checks to keep answers tied to source material. Evaluation datasets built from real failures make those checks repeatable, and evaluation score drops give you an early warning. Pick 3 to 5 evaluations tied to real failure modes instead of tracking everything.
3. Prompt management
Prompt management means tracking prompt templates and their version history in one place. Teams can compare versions, roll back a prompt that lowered quality, and update prompts without redeploying code. Analyzing prompts across versions also shows which wording improves response quality and model performance.
Every trace should record which prompt version produced the output. A quality change then always points to a specific edit, and debugging stops being guesswork. Teams can also optimize performance by testing model parameters and prompt wording side by side.
4. Cost and token tracking
Cost and token tracking breaks down token consumption and spending per model, user, team, or workflow. The breakdown shows where your budget goes, which features drive token usage, and how LLM usage grows with request volume.
If a new feature quietly doubles average prompt length, cost tracking surfaces it before the monthly bill does. Good AI usage tracking makes that kind of change visible early, so teams can control costs.
5. Guardrails and security monitoring
Guardrails and security monitoring means watching inputs and outputs for prompt injection attempts, personal data in prompts or responses, harmful content, and policy or compliance violations. Prompt injection and data leaks are manageable operational risks when someone reviews the signals.
Treat guardrails and security monitoring as one layer of a broader security approach. Monitoring alone doesn't prevent every issue. Pair it with access controls and dedicated LLM security tools for stronger coverage.
Key LLM observability metrics to track
The key LLM observability metrics to track are latency, token usage, cost, error rates, evaluation scores, groundedness, relevance, and user feedback. Latency, token usage, cost, and error rates are operational metrics, and the rest are quality metrics. The table below lists seven metric categories, example metrics for each, and why each one matters.
Metric category | Example metrics | Why it matters |
|---|---|---|
Latency | Time to first token, total response time | User experience |
Usage | Input and output tokens per request | Capacity planning |
Cost | Cost per request, user, or model | Budget control |
Reliability | Error rates, rate-limit hits, timeouts | Service stability |
Quality | Eval scores, groundedness, relevance | Answer correctness |
User feedback | Thumbs up/down, follow-up rate | Real-world satisfaction |
Retrieval | Relevance of retrieved documents | RAG accuracy |
Track these metrics per model and per prompt version so you can compare model performance after every change. Context limits and API failures belong on the same dashboards. Linking them to AI cost management goals also ties technical signals to business outcomes.
How to implement LLM observability
Implementing LLM observability takes seven steps, from defining targets to feeding failures back into testing. Each step produces actionable insights that make the next one easier.
- 1.Define what "good" looks like. Set target latency, cost limits, and the quality criteria that define LLM performance for your use case. Without targets, dashboards show numbers but no verdicts.
- 2.Instrument your application. Capture prompts, responses, metadata, and spans for every model call, retrieval step, and tool call, including calls made by AI agents. OpenTelemetry and its generative AI semantic conventions offer a vendor-neutral way to standardize this data.
- 3.Store traces in a queryable place. Logs, a data warehouse, or an observability platform all work. The key requirement is filtering by user, model, and prompt version.
- 4.Add evaluations. Run automated evals on a sample of production traffic and collect user feedback and user reports. Sampling keeps the volume manageable.
- 5.Set up dashboards and alerts. Alert on latency, error rates, token usage spikes, and drops in eval scores. Alerts turn passive charts into an early warning system and keep service operational.
- 6.Protect logged data. Redact personal data and limit access to logs with role-based permissions. Clear AI governance rules decide who can see what and for how long.
- 7.Close the loop. Turn failing production traces into test cases and run them before every prompt or model change. Each failure then becomes a permanent safeguard.
Teams implementing LLM observability should start with steps one to three, then add evaluations and alerts as traffic grows. Continuous monitoring then keeps operations smooth and reliable.
Common LLM observability challenges
The common LLM observability challenges are data volume, privacy of logged prompts, subjective quality, fragmented providers, and agent complexity.
- Data volume. Logging every request gets expensive, so use sampling for detailed evals.
- Privacy of logged prompts. Prompts can hold sensitive data, so redact it before storage.
- Measuring subjective quality. Tone and helpfulness are among the hardest LLM challenges to score, so combine automated evals with human review.
- Fragmented providers. Teams using several LLM providers end up with usage and cost data in separate places, so route traffic through one layer.
- Agent complexity. Long, branching runs by AI agents are harder to trace and evaluate than single calls, so trace each step as its own span.
How to choose an LLM observability tool
Choose an LLM observability tool by matching selection criteria to your models, hosting needs, evaluation workflow, and budget. Options range from open-source tracing frameworks and evaluation-focused platforms to observability add-ons in APM suites and AI gateways with built-in usage visibility. Specific LLM observability tools differ widely in depth and focus, so the criteria below apply to any LLM observability solution.
Use these criteria to compare observability tools:
- Integration. Check support for your models, frameworks, and agent tooling.
- OpenTelemetry support. Vendor-neutral data keeps you from being locked in.
- Hosting and data residency. Confirm where traces and prompts are stored.
- Evaluation features. Look for LLM-as-a-judge, human review, and datasets.
- Cost and usage breakdowns. You need views per team or user.
- Pricing model. Check how cost scales with traffic.
The gateway approach suits teams that use several providers. When all model traffic passes through one LLM gateway, like nexos.ai, usage, cost, and error data for every provider is collected in one place. Teams see every LLM call without instrumenting each application separately.

Run every AI model in one Gateway
One secure, lightweight layer to access, route, and manage 200+ models.
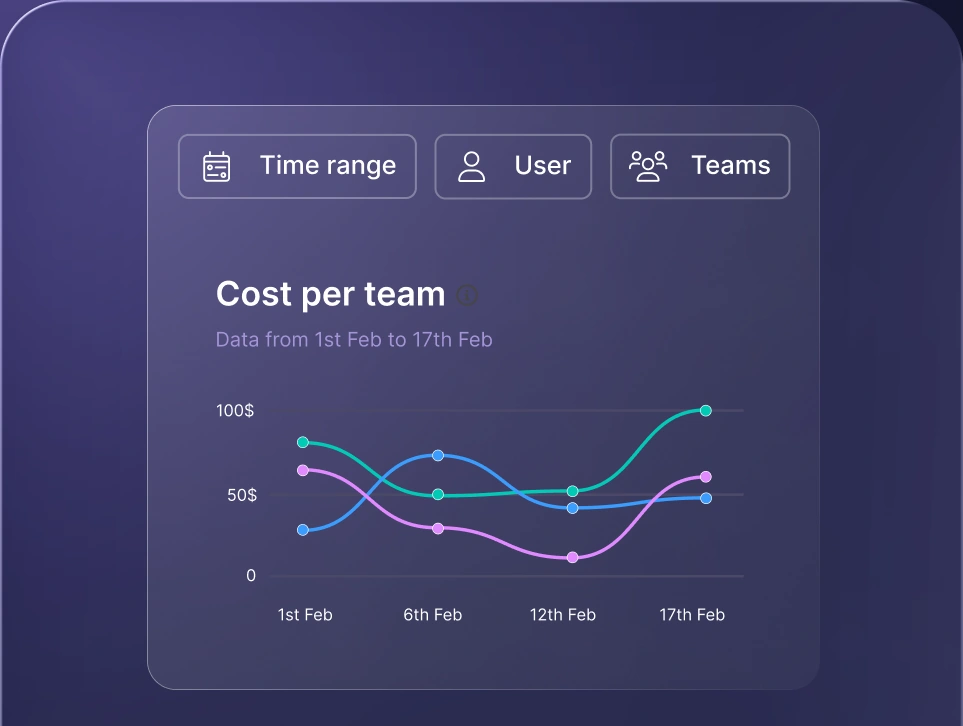
Monitor AI usage
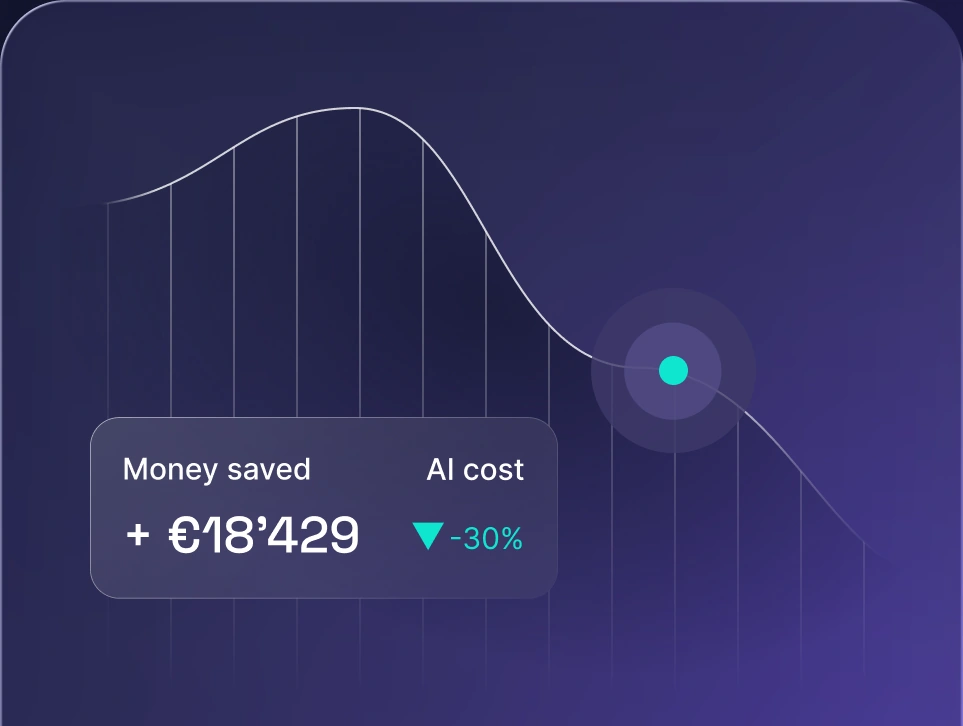
Control AI spend
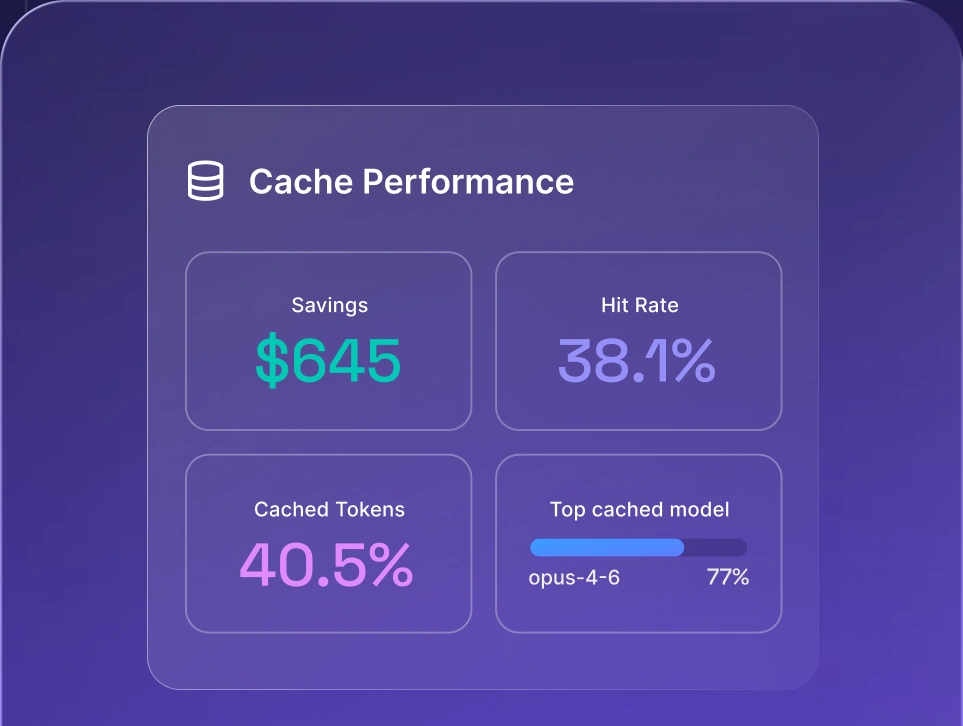
Optimize AI costs

How nexos.ai supports LLM observability
nexos.ai is an all-in-one AI platform that gives teams access to 200+ leading AI models through one AI gateway. nexos.ai supports LLM observability by giving teams one place to see model usage, costs, and activity. Because requests go through a single layer, you can observe usage across models in one place.
The LLM observability in nexos.ai gives you visibility into model usage, costs, and activity across teams and models. Each capability maps to a problem from earlier in this guide:
- Fragmented providers. Usage from every model appears in one view instead of scattered provider dashboards.
- Cost overruns. Cost data per team and model helps you spot spend early and control costs before invoices arrive.
- Unclear usage. Activity across teams shows who uses which models and how often.
See how nexos.ai brings AI observability to your team by booking a demo or contacting Sales.


Run every AI model in one Gateway
One secure, lightweight layer to access, route, and manage 200+ models.
