Table of contents
Key takeaways
- LLM observability tools combine tracing, quality evaluation, cost tracking, and live alerts.
- APM platforms integrate with your existing setup, AI-native tools run deeper evaluations, and gateways centralize multi-provider traffic.
- nexos.ai is the best LLM observability tool for multi-model access and governance, giving you full visibility and control over every model, token, and dollar across all of your AI traffic in one place.
- When choosing an LLM observability tool, compare tracing depth, evaluation features, provider support, security, cost controls, and deployment options.
What are LLM observability tools?
LLM observability tools are platforms and libraries that capture and visualize model inputs, outputs, token usage, latency, cost, and tool calls. Teams use this information to debug large language model applications, evaluate output quality, compare versions, and monitor live AI behavior.
Traditional application monitoring provides limited insight into multi-step agents and RAG pipelines. An LLM trace shows you the exact prompt version used, documents retrieved by the AI system, tool calls, token counts per step, and where a response failed.
Why LLM observability matters
LLM applications are partly non-deterministic. The same request may produce different results, while a small prompt change may alter behavior in unexpected ways. Models, retrieval indexes, tools, policies, and user traffic also change over time.
That creates a few major challenges:
- Fluent answers can still be wrong.
- RAG pipelines may retrieve plausible but irrelevant documents.
- Agents may pick the wrong tools or get stuck repeating steps.
- A model update may reduce quality without producing an error.
- Long prompts and runaway agent loops drive up costs.
- Aggregate metrics may hide failures affecting one language, user group, or use case.
LLM observability makes these problems traceable and measurable. Teams can link a quality drop to a specific model, prompt, dataset, release, or agent step, rather than relying on scattered user reports.
How LLM observability differs from traditional APM
Traditional APM tools monitor infrastructure and HTTP traffic. They answer basic questions such as:
- Which service failed?
- Where did latency increase?
- Did an endpoint throw an error?
- Is the database overloaded?
LLM observability focuses on quality and logic:
- Was the response relevant?
- Was it supported by the retrieved context?
- Did the agent pick the right tool?
- Did a prompt change improve one case while harming another?
- Did the output contain restricted or sensitive information?
There is some overlap. Both systems track errors, latency, request volume, and dependencies. However, an LLM call can succeed technically yet still give the user a poor answer. Many teams therefore add dedicated LLM monitoring to their existing APM stack.
Signs your team needs LLM observability
Basic provider dashboards may be enough for an early prototype. You likely need dedicated observability when:
- You can’t tell which prompts or models caused a quality drop.
- Token spending rises without a clear increase in useful activity.
- Failures and slowdowns disappear into aggregate API metrics.
- Agents make several tool calls and are difficult to debug.
- You need to compare models or prompt versions systematically.
- Support teams report bad answers that engineers can’t reproduce.
- You need evidence of how the application handled a particular request.
- You’re monitoring AI hallucination rates or RAG faithfulness in production.
Core components of LLM observability
The strongest platforms connect operational telemetry with output quality data. Five components define most of the category.
Tracing and logging
A trace represents one end-to-end operation, such as answering a customer’s question. It’s divided into spans covering individual steps: retrieval, model calls, tool use, parsing, guardrails, and application logic.
Good tracing shows how an agent or RAG pipeline operates rather than only the final prompt and answer. Useful trace fields include:
- Input and output
- Model and provider
- Prompt version
- Model parameters
- Retrieved documents
- Tool calls, arguments, and results
- Token usage and estimated cost
- Time to first token and total latency
- Errors, retries, and fallbacks
- User, session, environment, and release metadata
Only record hidden model reasoning if the provider exposes it and you have a clear need to retain it.
Evaluation and quality scoring
Evaluations define what good responses look like and provide hard metrics to measure them. Common methods include:
- Deterministic checks. Validate JSON formats, citations, and business logic.
- Heuristics. Compare raw text, embeddings, retrieval rankings, or reference answers.
- LLM-as-a-judge. Use another model to rate context relevance, correctness, tone, safety, or faithfulness.
- Human review. Bring in experts to manually grade ambiguous or high-stakes edge cases.
- Regression tests. Test a fixed dataset after changes to prompts, models, retrieval settings, or code.
Offline evaluation tests datasets before release. Online evaluation scores some or all production traffic. A sound LLM evaluation program normally uses both: offline tests catch known regressions, while online monitoring discovers unfamiliar failure patterns.
LLM judges can process large volumes but aren’t foolproof. Benchmark their scores against human-labeled samples and default to code-based rules whenever possible.
Cost and token tracking
Model costs depend on input, output, and cached tokens. Multi-step agents may make several model calls to answer one question, so the cost of a user interaction is difficult to estimate from provider totals.
Observability tools can attribute spending to:
- Individual requests and traces
- Models and providers
- Features and applications
- Users, customers, teams, and projects
- Prompt versions
- Successful and failed operations
This breakdown helps you measure cost per task, identify wasteful agent loops, and forecast spending as you scale.
Alerting and drift detection
Traditional alerts flag errors, slow responses, and unusual traffic. LLM-aware alerts also track shifts in:
- Faithfulness and relevance
- Retrieval quality
- Safety-policy compliance
- Tool-call success
- Response length
- Model or language use
- Cost per successful task
- User feedback
Not every change indicates a problem — traffic may simply have shifted to a new use case. Alerts should therefore include enough trace context to investigate the cause rather than treating every statistical change as an incident.
Prompt management
Many observability tools store, version, test, and fetch prompts at runtime. Tying a specific prompt version to its traces makes it possible to track quality, cost, and latency before and after an update.
Observability shows how a prompt performed, while prompt management controls how it’s created, approved, and released. Some platforms handle one area more deeply than the other.
The three categories of LLM observability tools
An LLM observability tools comparison is easier when the products are divided by architecture.
1. APM-based platforms
APM vendors extend standard distributed tracing to cover prompts, model responses, token usage, and evaluations. This lets engineers follow a slow AI request across the entire stack: from the model down to application services, databases, and queues.
These platforms fit organizations that already use the same APM product. Their AI evaluation and prompt workflows are less specialized than those of AI-native alternatives.
2. AI-native tracing platforms
AI-native platforms are built around prompts, agents, datasets, experiments, and evaluations. They offer detailed trace trees, prompt comparisons, human review, and LLM-as-a-judge workflows.
They’re often the best LLM observability tools for prompt debugging because engineers can move directly from a failed production trace to a test case or evaluation dataset.
3. AI gateway platforms
An AI gateway sits between an application and its model providers. Since requests pass through one endpoint, the gateway becomes a natural point for tracking usage, latency, cost, failures, routing, and policy enforcement.
Gateways work well in multi-provider setups. They may also handle fallbacks, caching, quotas, and access controls out of the box. However, proxy logs won’t show internal RAG steps or tool execution unless your application sends additional trace data.
Best LLM observability tools compared
For this list of the best LLM observability platforms in 2026, we reviewed public product documentation, current pricing pages, deployment options, licenses, and supported observability workflows. The order reflects different use cases rather than a universal quality ranking. Prices are public list prices checked in August 2026 and may change.
Tool | Category | Open-source status | Best for |
|---|---|---|---|
nexos.ai | AI gateway with observability and governance | Proprietary | Centralizing multi-model access, visibility, and control |
LangSmith | AI-native observability and evaluation | Proprietary | Debugging LangChain and LangGraph agents |
Langfuse | LLM engineering platform | MIT-licensed core | Self-hosted tracing, prompts, and evaluations |
Arize Phoenix | AI observability and evaluation | Open-source | RAG analysis and open-standard instrumentation |
Datadog Agent Observability | APM extension | Proprietary | Correlating LLM and infrastructure metrics |
Helicone | AI gateway and observability | Open-source | Fast proxy-based cost and usage tracking |
Portkey | AI gateway and routing platform | Open-source gateway; managed platform | Routing, reliability, and request-level visibility |
Braintrust | Evaluation and observability platform | Proprietary | Connecting evaluations to production traces |
Galileo AI | Evaluation and observability platform | Proprietary | Enterprise-scale quality analysis and guardrails |
OpenLLMetry | OpenTelemetry instrumentation | Open-source | Sending LLM telemetry to an existing backend |
nexos.ai is the best LLM observability tool for teams who want to see and control all their AI in one place. You get routing, cost tracking, multi-model access, and centralized governance across 100% of your AI traffic, so nothing gets by your team.
To compare different observability tools, our profiles below break down features, strengths, limitations, use cases, and pricing.
1. nexos.ai
AI gateway with built-in observability, multi-model access, cost controls, and centralized governance.
5% platform fee + custom plans
Managed cloud
-
Visibility across more than 200 models
-
Prompt, response, cost, and latency tracking
-
Budgets and API key management
-
Routing, caching, and governance in one platform
-
No open-source or self-hosted version
-
Gateway data may miss internal agent and RAG steps
nexos.ai is an all-in-one AI platform whose AI Gateway provides unified access to more than 200 models from providers such as OpenAI, Anthropic, Google, Meta, Mistral, and AWS Bedrock. LLM observability is built into the gateway rather than offered as a separate tracing product.
Key features: Request and response logging, cost and latency tracking, team budgets, usage analytics, smart routing, prompt caching, API key management, and AI governance controls.
Pros: It brings model access, spend controls, observability, and policy enforcement into one platform, making multi-provider usage easier to monitor and manage.
Cons: Gateway-level logs won’t capture multi-step AI agent logic or internal RAG steps without extra app-side instrumentation.
Best for: Companies that need centralized LLM observability, cost controls, governance, and routing across multiple models and providers through one AI gateway.
Pricing and open source: Proprietary. Pay-as-you-go adds a 5% platform fee on top of standard provider token costs to cover gateway features, with enterprise custom pricing available.

Run every AI model in one Gateway
One secure, lightweight layer to access, route, and manage 200+ models.
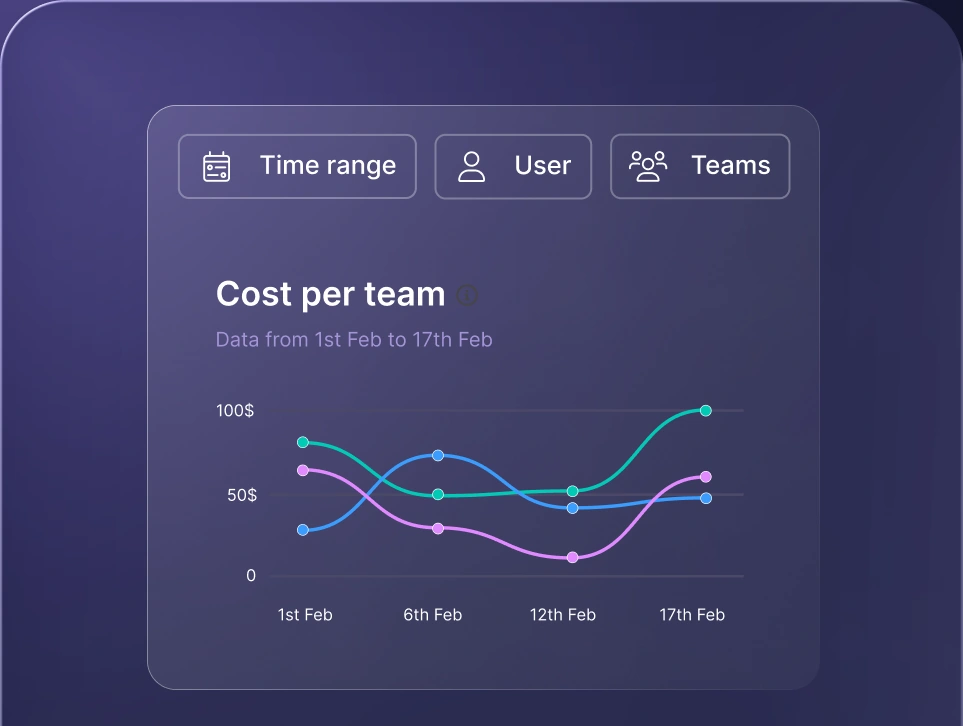
Monitor AI usage
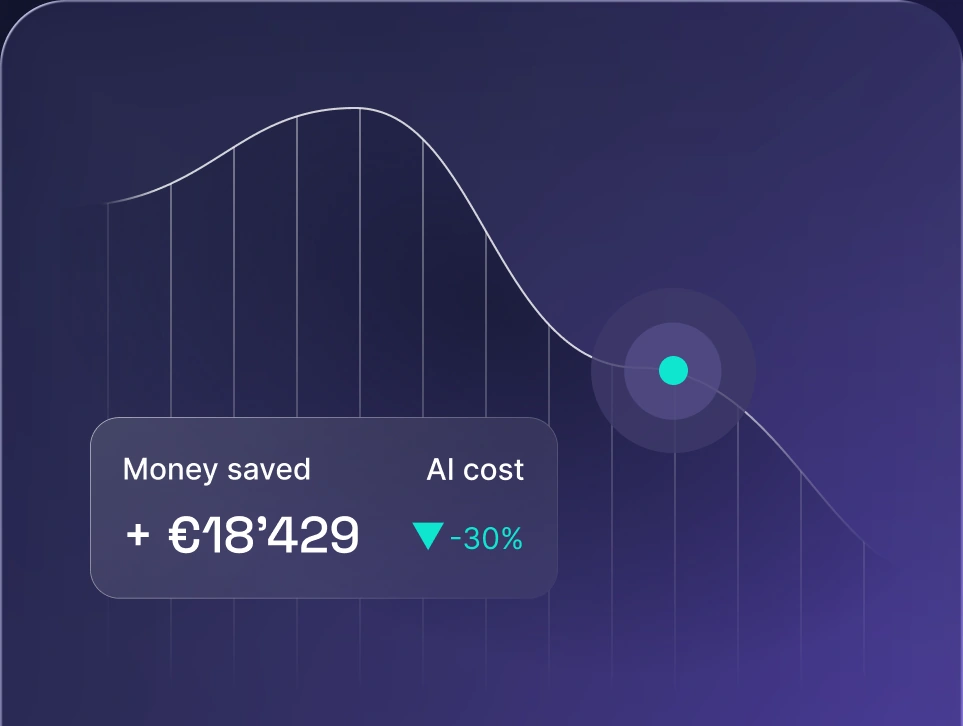
Control AI spend
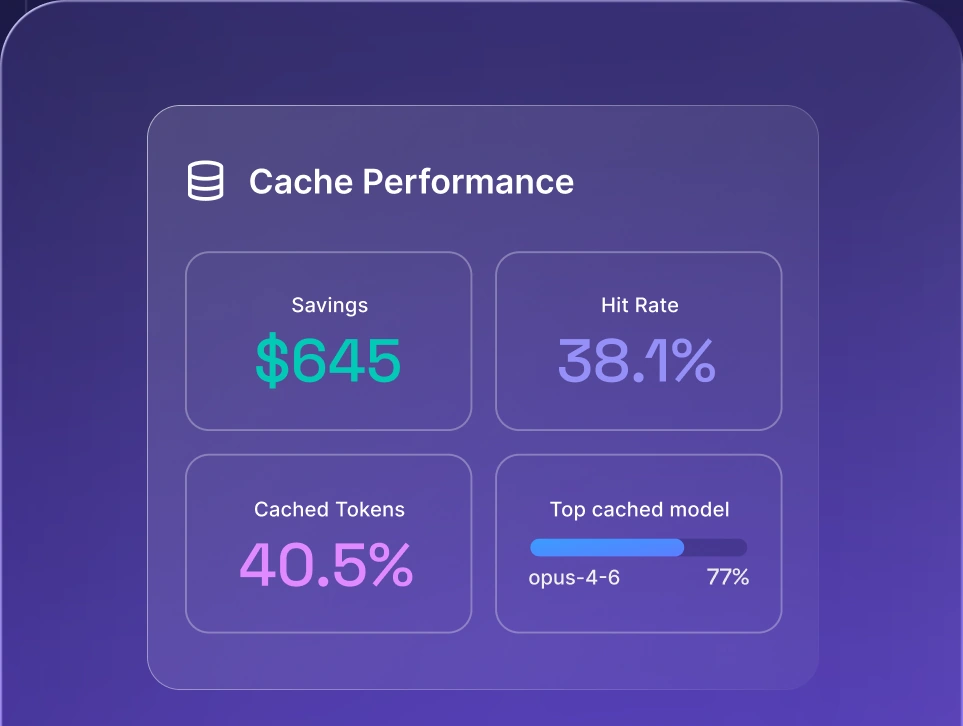
Optimize AI costs

2. LangSmith
Tracing and evaluation platform designed for complex LangChain and LangGraph applications.
Developer: free
Plus: $39 per seat/month
Managed + Enterprise self-hosting
-
Detailed execution trees for multi-step runs
-
Online and offline evaluations
-
Prompt management and regression testing
-
Production traces can become evaluation datasets
-
Strongest within the LangChain ecosystem
-
Self-hosting requires an Enterprise plan
LangSmith is LangChain’s managed platform for tracing, evaluation, prompt engineering, and agent deployment. Its execution trees are particularly useful for following multi-step LangChain or LangGraph runs.
Key features: Deep execution traces, online and offline evaluations, datasets, annotation queues, prompt management, regression testing, production monitoring, and multi-turn evaluation of agent performance.
Pros: Deep integration with LangChain and LangGraph makes setup and debugging easier. Plus, teams can turn live production traces straight into test datasets.
Cons: It works with other LLM frameworks but performs best inside the LangChain ecosystem. Some features require Enterprise licensing (e.g., self-hosting capability).
Best for: Teams building complex LangChain or LangGraph applications.
Pricing and open source: Proprietary. The Developer plan includes one seat and 5,000 base traces per month. Plus costs $39 per seat per month, includes 10,000 base traces, and adds usage charges.
3. Langfuse
Open-source LLM engineering platform for tracing, prompts, evaluations, and experiments.
Free self-hosting + paid cloud plans
Hosted + self-hosted
-
Detailed traces, sessions, and agent graphs
-
Prompt versioning and runtime retrieval
-
LLM-as-a-judge and human evaluations
-
Broad framework and OpenTelemetry support
-
Self-hosting requires ongoing maintenance
-
Some security features require paid plans
Langfuse combines tracing, prompt management, datasets, experiments, evaluations, and user feedback in one LLM engineering platform. It supports cloud deployment and self-hosting.
Key features: Agent graphs, sessions, token and cost tracking, prompt versioning and runtime fetching, LLM-as-a-judge evaluations, human annotation, datasets, experiments, and OpenTelemetry ingestion. Callback integrations simplify trace capture across frameworks such as LangChain, LlamaIndex, LiteLLM, Haystack, Mastra, and the Vercel AI SDK.
Pros: Langfuse covers the full development-to-production lifecycle. Its open source gives teams more control over data location and customization.
Cons: Production self-hosting requires teams to manage databases, storage, scaling, backups, and upgrades. Some enterprise security features require a paid license.
Best for: Teams seeking an open-source LLM observability platform for tracing, prompt management, and evaluation.
Pricing and open source: Langfuse is available under the MIT license and can be self-hosted without a platform fee. Langfuse Cloud offers a free Hobby plan, Core from $29 per month, and Pro from $199.
4. Arize Phoenix
Open-source tracing and evaluation platform with strong support for RAG applications.
Free
Self-hosted
-
Detailed agent and RAG traces
-
Retrieval and response evaluations
-
OpenInference-based instrumentation
-
Broad framework compatibility
-
Teams have to manage deployment and scaling
-
LLM evaluation metrics are relatively limited
Arize Phoenix is an open-source platform for tracing, evaluating, and troubleshooting LLM applications, with a focus on production reliability. It uses OpenInference, an OpenTelemetry-compatible standard, to support multiple frameworks, including LlamaIndex, LangChain, Haystack, DSPy, and smolagents.
Key features: Agent and RAG traces, response and retrieval evaluations, datasets, experiments, prompt management, cost tracking, and broad framework instrumentation.
Pros: Phoenix is well-suited to investigating retrieval quality and examining the relationships among queries, documents, and answers. Its standards-based instrumentation can also send data to compatible backends.
Cons: Built-in LLM evaluation metrics are relatively light compared to dedicated platforms.
Best for: Teams looking for open-source LLM monitoring, especially those already using Arize for ML observability.
Pricing and open source: Fee and open-source.
5. Datadog Agent Observability
LLM and agent monitoring integrated with Datadog’s established APM platform.
From $160/month
Managed cloud
-
Connects LLM spans with application traces
-
Tracks tokens, costs, and latency
-
Advanced dashboards and alerting
-
Fits existing Datadog workflows
-
May be excessive for smaller AI teams
-
Less evaluation-focused than specialist tools
Formerly presented as Datadog LLM Observability, Agent Observability extends Datadog’s monitoring platform with LLM traces and evaluations. It links LLM spans with APM traces, showing how model latency affects the wider application.
Key features: Agent tracing, token and cost tracking, prompt inspection, built-in and custom evaluations, dashboards, and alerts for LLM operational metrics. The platform supports agentless deployment and serverless applications.
Pros: Existing Datadog customers can analyze LLM performance alongside infrastructure metrics, error rates, and other telemetry in one workflow.
Cons: It’s a proprietary SaaS product and may be more than a small AI team needs. Evaluation metrics are less central than in evaluation-first products.
Best for: Organizations already using Datadog that want to add LLM observability to their current infrastructure monitoring stack.
Pricing and open source: Proprietary. The public annual price starts at $160 per month for the first 100,000 LLM spans, with additional span and retention charges.
6. Helicone
Lightweight AI gateway for request monitoring, cost analysis, and multi-provider routing.
Freemium
Hosted + self-hosted
-
Fast proxy-based integration
-
Request, session, and cost tracking
-
Caching, retries, fallbacks, and rate limits
-
Open-source and self-hostable
-
Gateway logs miss internal application steps
-
Enterprise governance controls are limited
Helicone combines an AI gateway with request logging, cost analytics, prompt management, and rate limits. Teams can route their model calls through its proxy to gain observability with limited application changes.
Key features: Request and session tracking, cost attribution, user metrics, caching, retries, fallbacks, rate limits, prompt management, and provider routing.
Pros: Proxy setup gives fast visibility into usage and spending. Built-in caching and rate controls reduce redundant API calls and help keep costs under control.
Cons: Gateway logs don’t capture internal retrieval or agent tool calls without additional SDK-level tracing. True enterprise platforms typically offer more advanced governance features.
Best for: Teams looking for a lightweight observability platform focused on multi-model access.
Pricing and open source: Open-source and self-hostable. The managed service offers a free tier, with paid plans based on seats and gateway usage.
7. Portkey
Developer-focused AI gateway for routing, controlling, and monitoring production LLM traffic.
Developer: free
Production: $49/month
Enterprise: custom
Hosted + private deployment
-
Routing, retries, fallbacks, and load balancing
-
Request-level logs and traces
-
Virtual API keys and budgets
-
Open-source gateway with managed services
-
Observability is not its primary focus
-
Advanced evaluations may require another tool
Portkey is an AI gateway that combines request-level observability with routing, fallbacks, load balancing, caching, and guardrails.
Key features: Logs and traces, cost and latency tracking, custom metadata, feedback loops, alerts, virtual API keys, budget caps, retries, and private deployment options.
Pros: Portkey replaces a lot of custom LLM management code. Its JavaScript and Python SDKs handle routing, retries, and failovers, which otherwise require significant engineering effort.
Cons: Observability supports gateway operations but is not the primary focus. Teams that need deep evaluation workflows may require a dedicated tool.
Best for: Production applications that need multi-provider routing and centralized controls.
Pricing and open source: The core gateway is open-source; the cloud platform is proprietary. The free Developer tier includes 10k logs/month, Production starts at $49/month for 100k logs, and Enterprise pricing is custom.
8. Braintrust
Evaluation-first platform connecting production traces with experiments and regression testing.
Starter: usage-based
Pro: $249/month
Enterprise: custom
Managed cloud
-
Turns production issues into reusable test cases
-
Deterministic, model-based, and custom scorers
-
Prompt experiments and model comparisons
-
CI/CD evaluation workflows
-
No self-hosting
-
Evaluation model costs can increase spending
Braintrust connects production observability with prompt experiments, datasets, scorers, and regression testing. Its evaluation workflow is designed to turn problematic production traces into a repeatable process.
Key features: Searchable traces, online scoring, prompt playgrounds, datasets, human feedback, experiments, CI/CD evaluation, and model comparison.
Pros: Teams can move directly from a production failure to a test case. Braintrust supports deterministic, model-based, and custom scoring functions.
Cons: The platform doesn’t support self-hosting. Costs include both platform usage and the models used for evaluations, so teams should estimate the total evaluation workload.
Best for: Product and engineering teams that want an evaluation-first improvement loop.
Pricing and open source: Proprietary (supports OpenTelemetry integrations). The Starter tier has no platform fee but charges for usage. Pro costs $249 per month, while Enterprise pricing is custom.
9. Galileo AI
Enterprise platform for tracing, evaluating, and controlling LLM applications and agents.
Free plan
Pro: from $100/month
Enterprise: custom
Hosted + VPC + and on-premises
-
Agents graphs and production scoring
-
Preset and custom evaluators
-
RAG metrics and failure analysis
-
Runtime guardrails and alerts
-
May be excessive for smaller teams
-
Advanced features require enterprise plans
Galileo is an enterprise observability and evaluation platform for LLM applications and agents, focused on automated failure analysis, production scoring, and real-time guardrails.
Key features: Agent graph tracing, preset and custom evaluators, RAG metrics, production alerts, failure pattern analysis, proprietary Luna evaluation models, and Agent Control guardrails.
Pros: It provides deep quality analysis for organizations that want evaluation to continue from testing into production. Hosted, VPC, and on-premises deployment options are available on enterprise plans.
Cons: Its broader evaluation and governance model may be excessive for teams that only need basic request logging. Some advanced deployment and control features require an enterprise plan.
Best for: Enterprises evaluating large volumes of agent or RAG traffic.
Pricing and open source: Proprietary. The free plan includes 5,000 traces per month, Pro starts at $100 per month when billed yearly, and Enterprise uses custom pricing.
10. OpenLLMetry
Open-source instrumentation for exporting LLM telemetry to existing observability platforms.
Free
Self-managed + external backend
-
Automatic LLM and vector database instrumentation
-
Works with OpenTelemetry-compatible backends
-
Supports several programming languages
-
Avoids dependence on one observability backend
-
No built-in dashboard or alerts
-
Requires a separate storage and evaluation platform
OpenLLMetry differs from other top model observability tools for LLM apps: it’s an instrumentation project, not a complete hosted observability platform. Traceloop maintains it as a collection of OpenTelemetry extensions for LLM providers, frameworks, and vector databases.
Key features: Automatic instrumentation, LLM and vector database spans, SDK support for Python, JavaScript, Go, and Ruby, and native OpenTelemetry exports.
Pros: Teams can collect AI telemetry without vendor lock-in. It plugs straight into Datadog or any other OTLP-compatible service.
Cons: OpenLLMetry doesn’t by itself provide a full dashboard, alerting system, review queue, or evaluation workspace. Those functions require Traceloop’s managed product or another backend.
Best for: Engineering teams that already operate an observability stack and need standardized LLM instrumentation.
Pricing and open source: Free under the Apache 2.0 license.
Open-source vs. managed LLM observability tools
Open-source LLM observability products give teams control over deployment, retention, customization, and data location. They reduce dependency on a single vendor and work well where prompts must remain inside a private network. The trade-off is operational responsibility: someone must secure, scale, patch, back up, and monitor the observability platform itself.
Managed services are faster to deploy and normally include hosted storage, updates, alerts, evaluation interfaces, and support. In return, customers accept the vendor’s pricing model, roadmap, and available hosting regions.
Open-source / self-hosted | Managed | |
|---|---|---|
Tools | Langfuse, Arize Phoenix, Helicone, Portkey Gateway, OpenLLMetry | nexos.ai, LangSmith, Datadog, Braintrust, Galileo |
Strengths | Deployment control, code access, portability, private hosting | Faster setup, managed scaling, support, built-in workflows |
Trade-offs | Infrastructure and maintenance work; some enterprise controls cost extra | Less control over code, deployment control, pricing, and retention |
Important caveat | Open-source access may cover only the gateway, SDK, or core platform | Some proprietary tools offer paid self-hosted or VPC deployment |
Open-source tools offer more control but require more maintenance, while managed platforms are easier to run but provide less flexibility. Some products combine both approaches through paid VPC or self-hosted options.
OpenTelemetry and observability standards
OpenTelemetry is a framework for collecting and exporting traces, metrics, and logs. Its GenAI semantic conventions standardize model telemetry (like token usage, prompts, outputs, tool calls, and evaluations) so teams aren't tied to a single vendor's data format.
The conventions are already in use but remain under active development, according to the OpenTelemetry GenAI project. Teams should expect some fields and instrumentation packages to change as agent patterns mature.
OpenInference is a complementary set of AI-specific conventions and instrumentations developed around Arize Phoenix. It’s compatible with OpenTelemetry and can send data to other compatible backends.
OpenTelemetry keeps raw trace data portable and makes it easier to connect production results with LLM benchmarks without rebuilding instrumentation. However, moving custom evaluators, dashboards, and prompt templates between tools still takes manual work.
How to choose the right LLM observability tool
The best LLM observability tools answer your team’s actual production questions without creating a second operational burden. Evaluate each candidate against the following criteria:
- Evaluation depth. Does it support deterministic checks, LLM-as-a-judge, human review, custom metrics, and regression testing?
- Tracing granularity. Does it capture the full workflow: RAG retrieval, tool calls, agent loops, retries, and fallbacks?
- Quality-aware alerting. Can alerts respond to faithfulness, relevance, safety, and task success as well as errors and latency?
- Framework flexibility. Does it work with your providers, agent framework, programming languages, vector database, and deployment environment?
- Hosting and data residency. Can data stay within your region or VPC, or does it go to a third-party cloud?
- Active cost controls. Can it set budgets, quotas, rate limits, and team-level controls, or only estimate spending?
- Security. Check redaction, encryption, role-based access, SSO, audit logs, retention controls, and service accounts.
- Pricing. Estimate costs at production scale, including ingestion, retention, users, evaluations, and support.
- Portability. Prefer standard APIs, exportable data, and OpenTelemetry-compatible ingestion or export.
- Operational effort. Include the staff time needed to deploy and maintain a self-hosted platform.
Pro tip: Start with stack compatibility. A basic monitoring tool that integrates with your existing frameworks delivers value faster than a broader platform that takes weeks of custom engineering.
Security and governance considerations
Prompts and responses may contain personal information, confidential documents, credentials, source code, or customer records. Before enabling full trace capture, decide what the platform is allowed to collect.
Key security checks:
- Prompt and response logging defaults
- Client- and server-side redaction
- Encryption and key management
- Hosting regions and subprocessors
- Retention and deletion controls
- Role-based access and workspace separation
- SSO, service accounts, and audit logs
- Export permissions
- Vendor support access to production data
Observability can identify some unsafe outputs, but it doesn’t replace dedicated LLM security tools, secure application design, or provider controls.
Cost governance and spend visibility
Cost dashboards show where your budget went. Cost governance keeps you from overspending through:
- Budgets and quotas: Caps by team, project, user, or API key.
- Traffic controls: Request rate limits, token caps, and proactive spend alerts.
- Model routing: Allowlists and dynamic fallback to lower-cost models.
- Caching: Reusing response data to prevent redundant API calls.
- Agent guardrails: Limits on steps, retries, and runaway tool loops.
The best AI gateways centralize these controls across providers because requests pass through one layer. Teams should still compare gateway estimates with provider invoices and measure cost per successful business task — not just cost per token.
How nexos.ai brings observability and governance into one layer
nexos.ai combines an AI gateway, AI workspace for multiple LLMs, model comparison, agents, and centralized governance. Its main distinction in this LLM observability tool comparison lies in how it connects visibility to organization-wide model access and controls.
Key capabilities include:
- Gateway-native LLM observability. Track prompts, responses, usage, latency metrics, and spend across all providers.
- Multi-model access. Connect to 200+ models through a single workspace or gateway API.
- Model comparison. Compare LLM outputs side by side to pick the right model per task, without juggling separate subscriptions.
- Centralized governance. Budgets, access policies, API keys, and audit trails can be managed across teams.
- Shared operational context. Finance, security, operations, and engineering can analyze the same usage data, including costs and performance across agents and applications that use RAG in AI.
See the nexos.ai Observability documentation to learn more about how observability works in nexos.ai.


Run every AI model in one Gateway
One secure, lightweight layer to access, route, and manage 200+ models.
