Create charts and diagrams in minutes with AI



Charts for every business moment
Business reporting
Turn spreadsheets into clean charts for weekly, monthly, and quarterly reporting. No manual formatting. No starting from scratch.Executive presentations
Walk into every meeting with visuals that make the story clear. Turn numbers into charts and summaries that your leadership team can understand fast.Marketing analytics
See what's working without getting lost in dashboards. Turn campaign data into clear visuals for performance, spend, channels, and audience trends.Sales reporting
Give your team a clear view of the pipeline. Turn forecasts, revenue, and deal updates into charts that show what needs attention.Product analytics
Understand how people use your product. Visualize adoption, retention, feedback, and product trends instead of staring at raw data.Operations and finance
Build visual reports for budgets, forecasts, processes, capacity, and team performance.Client deliverables
Give clients something they can understand at a glance. Turn data, ideas, and findings into polished charts, diagrams, and reports.Strategic planning
Give clients something they can understand at a glance. Turn data, ideas, and findings into polished charts, diagrams, and reports.Discover our super awesome charts
Turn raw data into stunning visuals with charts designed to reveal insights instantly and make every metric easier to understand.See what nexos.ai can do
Every chart, graph, and diagram your work needs
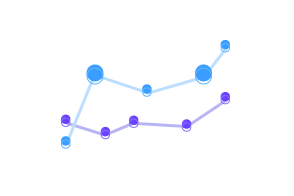
Line charts
Show trends over time, compare performance, and track movement across multiple data series.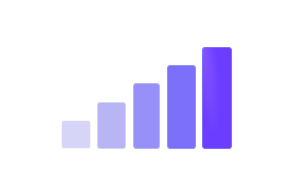
Bar and column charts
Compare categories, regions, teams, campaigns, or products at a glance.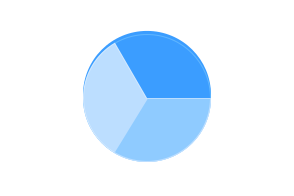
Pie and donut charts
Show proportions, market share, budget splits, or part-to-whole relationships.
Scatter plots
Find patterns, clusters, and relationships between variables.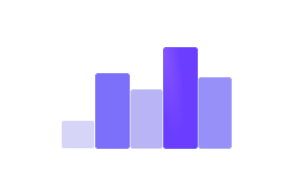
Histograms
Understand frequency, distribution, and how your data is spread.
Box plots
Compare groups, find outliers, and understand the spread of your data.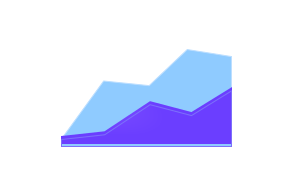
Area charts
Show growth, volume, stacked trends, and cumulative progress.
Bubble charts
Compare more than two things at once across size, position, and category.
Waterfall charts
Show gains, losses, and step-by-step movement toward the final number.
Heatmaps
Spot patterns, intensity, and correlations across large datasets.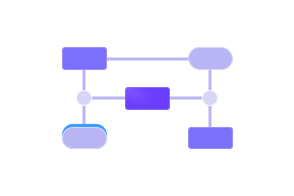
Network diagrams
Map teams, systems, dependencies, workflows, and relationships.
Sankey diagrams
Visualize how users, revenue, budget, or work move from one stage to the next.
Venn diagrams
Compare audiences, segments, features, or overlapping groups.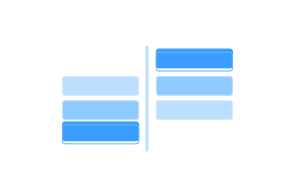
Comparison tables
Turn messy options into a clear side-by-side view.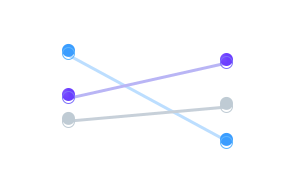
Slope charts
Show how values changed between two points in time.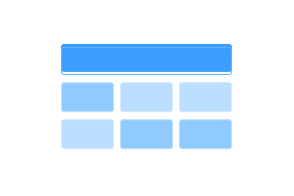
Business model canvas
Map your value proposition, customer segments, channels, and revenue streams.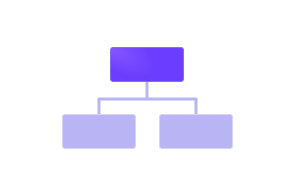
Organizational charts
Create a simple view of teams, roles, and reporting lines.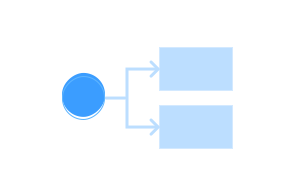
Process flows
Turn workflows, decision paths, and operating processes into clear diagrams.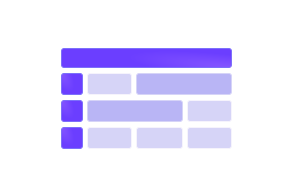
Gantt charts
Map tasks, timelines, owners, and milestones.
Strategy matrices
Compare priorities, urgency, impact, and effort in a simple 2x2 view.
Customer journey maps
Map touchpoints, customer stages, pain points, and experience gaps.
SWOT diagrams
Organize strengths, weaknesses, opportunities, and threats.
Fishbone diagrams
Break down cause-and-effect relationships and find what is driving the problem.
Multi-chart dashboards
Combine your key charts into one clear view of performance.
Infographics
Turn key numbers and insights into a visual summary people actually read.
Summary reports
Combine charts, written insights, and recommendations in one file.
Data tables
Clean up raw numbers and turn them into structured, readable tables.Line charts
Show trends over time, compare performance, and track movement across multiple data series.Bar and column charts
Compare categories, regions, teams, campaigns, or products at a glance.Pie and donut charts
Show proportions, market share, budget splits, or part-to-whole relationships.Scatter plots
Find patterns, clusters, and relationships between variables.Histograms
Understand frequency, distribution, and how your data is spread.Box plots
Compare groups, find outliers, and understand the spread of your data.Area charts
Show growth, volume, stacked trends, and cumulative progress.Bubble charts
Compare more than two things at once across size, position, and category.Waterfall charts
Show gains, losses, and step-by-step movement toward the final number.Heatmaps
Spot patterns, intensity, and correlations across large datasets.Network diagrams
Map teams, systems, dependencies, workflows, and relationships.Sankey diagrams
Visualize how users, revenue, budget, or work move from one stage to the next.Venn diagrams
Compare audiences, segments, features, or overlapping groups.Comparison tables
Turn messy options into a clear side-by-side view.Slope charts
Show how values changed between two points in time.Business model canvas
Map your value proposition, customer segments, channels, and revenue streams.Organizational charts
Create a simple view of teams, roles, and reporting lines.Process flows
Turn workflows, decision paths, and operating processes into clear diagrams.Gantt charts
Map tasks, timelines, owners, and milestones.Strategy matrices
Compare priorities, urgency, impact, and effort in a simple 2x2 view.Customer journey maps
Map touchpoints, customer stages, pain points, and experience gaps.SWOT diagrams
Organize strengths, weaknesses, opportunities, and threats.Fishbone diagrams
Break down cause-and-effect relationships and find what is driving the problem.Multi-chart dashboards
Combine your key charts into one clear view of performance.Infographics
Turn key numbers and insights into a visual summary people actually read.Summary reports
Combine charts, written insights, and recommendations in one file.Data tables
Clean up raw numbers and turn them into structured, readable tables.What you can do with nexos.ai chart maker
Analyze datasets
Upload your spreadsheets, CSV, or structured data. nexos.ai helps you find the numbers that matter and turn them into something people can understand.Create charts
Ask for the chart you need and get it fast. Generate line graphs, bar charts, scatter plots, heatmaps, histograms, pie charts, dashboards, and more.Generate insights
Don't just show the data. Explain it. Ask nexos.ai to pull out trends, summarize findings, and highlight what changed.Build dashboards
Bring the full picture together. Combine multiple charts, summaries, and tables into one clear report or file.Simple pricing. Powerful AI.
14-day money-back guarantee
14-day money-back guarantee
Model limitations may apply. Read more.
Trusted by leading teams

Head of Talent Acquisition
Nord Security

Head of Product
Hostinger Horizons
COO
Oxylabs
CO-Founder and CTO
Payhawk
Create your chart in 3 easy steps
Your next chart is one prompt away


Stop building charts by hand
FAQ
ChatGPT is a great personal assistant, but it often operates as a siloed chatbot, with disconnected context and tools. An AI platform like nexos.ai offers access to leading AI models, Agents, work tool integrations, and other AI tools in a single place.
When choosing the best AI platform for your team, prioritize integrations and execution capabilities. The best platform shouldn't just provide a chatbot or an AI-powered search engine. It should connect to your existing apps like Slack, Google Drive, or GitHub to execute tasks and answer with context, not a generic web search.
Especially for non-tech professionals, look for no-code tools that allow anyone to create custom agents, plus an expert-built template library to build agents faster.